
// HI, I’M Chandra Prabhudev,…
{” _Data-First Digital Marketer”}
{/}
<about_me>
…Merging advanced automation with Generative Engine Optimization (GEO) to build future-proof acquisition engines for market leaders.
…10 years of technical expertise meets 8 years of elite marketing strategy. I specialize in building automated, GEO-optimized web environments that turn technical complexity into business scale. From engineering to $1M+ budget management, I deliver digital infrastructure that performs.;
…High-ticket growth requires more than just “running ads”—it requires a unified media strategy backed by ironclad data. I manage multi-million dollar budgets across Google Ads, Meta Ads, and Bing Ads, while expanding brand reach through CTV and traditional TV advertising. To ensure every dollar is accountable, I implement advanced tracking via Google Tag Manager and GA4, coupled with Microsoft Clarity to visualize user behavior. This data is then synthesized into high-level business intelligence reports using Looker Studio and Tableau, giving stakeholders the clarity they need to make informed investment decisions.;
(!)
<portfolio>
Engineering-grade digital growth. I leverage Python, SQL, and n8n automation to build self-hosting infrastructures and server-side tracking systems. This portfolio showcases my ability to turn technical complexity into scalable, high-performance business assets.
{ $1.5M Monthly Spend: Scaling a 40+ Location Dental Group }
//…Managing massive budgets across Google and Meta Ads while maintaining a stable CPA. Mention how you handled the complexity of local vs. national targeting.;

{ GEO & AEO: Dominating AI-Driven Search Environments }
//…Show how you’ve moved beyond traditional SEO to optimize for AI-driven answers (Perplexity, Gemini). This shows you are ahead of the 2026 market curve.;

{ Headless Automation }
//…Describe how you used an EC2 instance to automate lead flow, CRM syncing, or reporting. Highlight how this “headless” infrastructure reduced manual work and costs.;
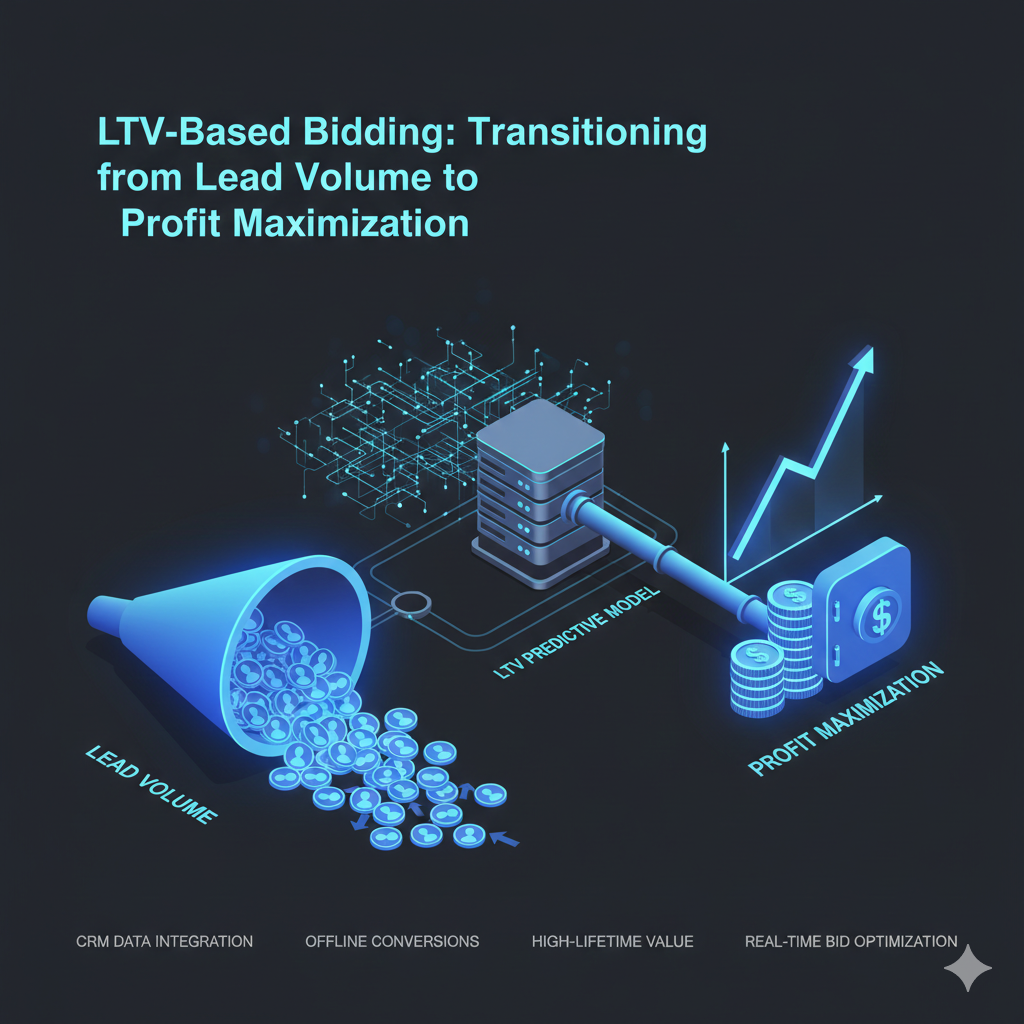
{ LTV-Based Bidding: Transitioning from Lead Volume to Profit Maximization. }
//…Explain how you integrated CRM back-end data (using your EC2/Headless skills) to feed “Offline Conversions” back into Ad Platforms. You weren’t just bidding for clicks; you were bidding for the customers most likely to stay for 3+ years.;
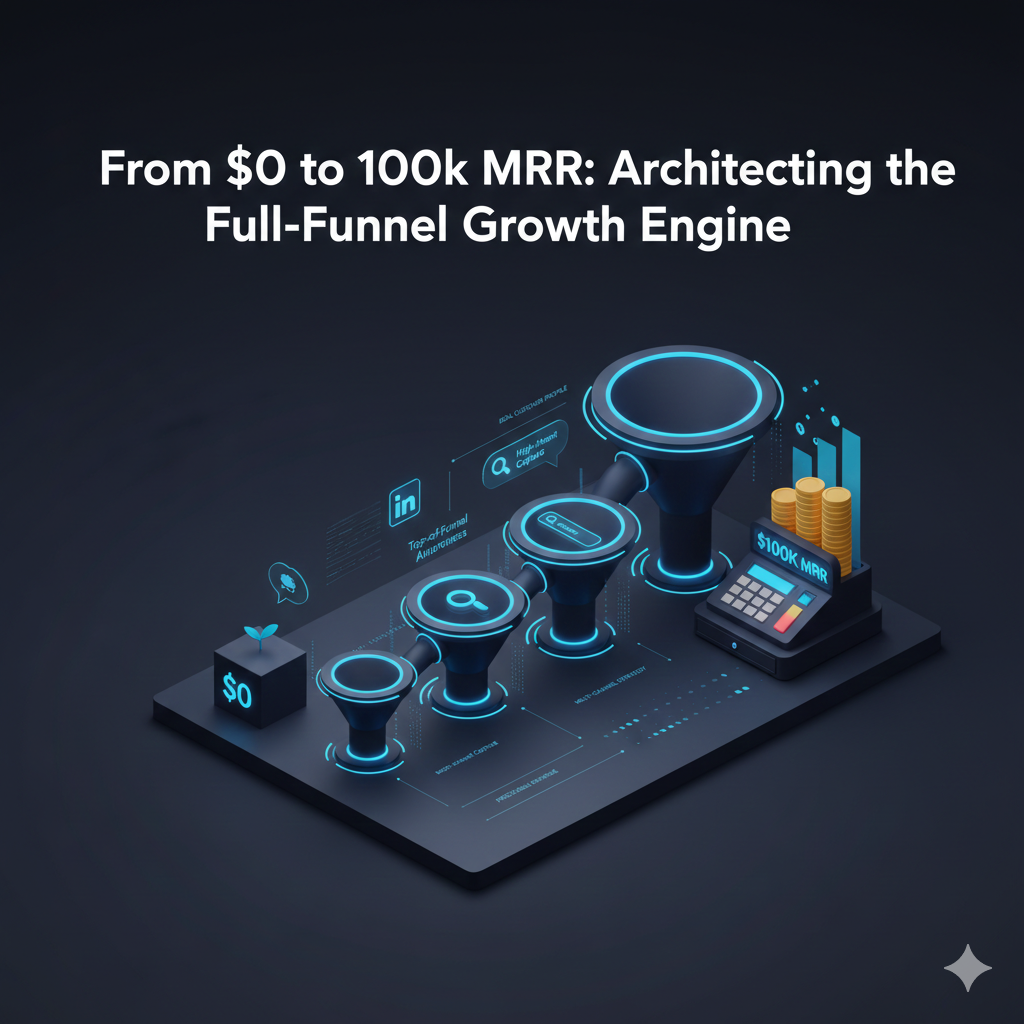
{ From $0 to $100k MRR: Architecting the Full-Funnel Growth Engine. }
//…Detail how you identified the “Ideal Customer Profile” (ICP) and built a multi-channel approach—using LinkedIn for top-of-funnel awareness and Google Search for high-intent capture.;
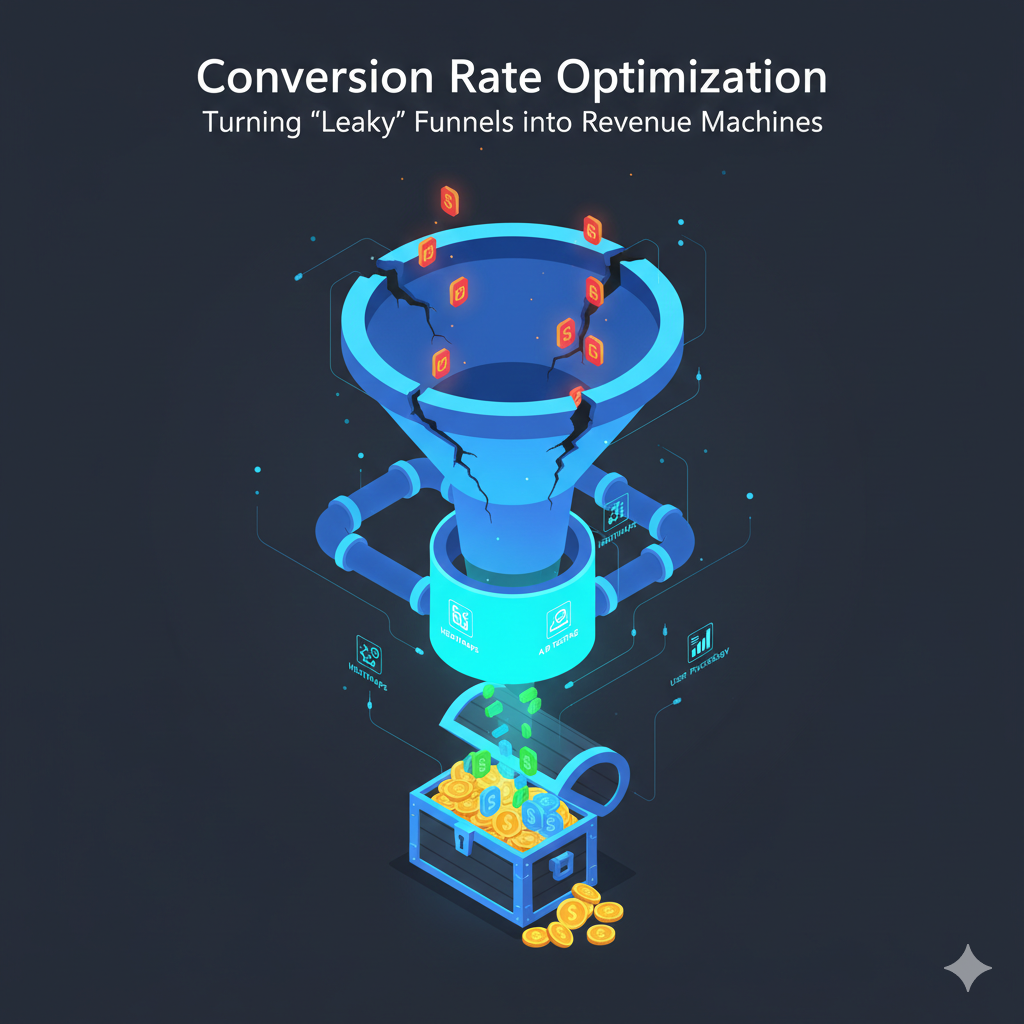
{ Conversion Rate Optimization: Turning “Leaky” Funnels into Revenue Machines. }
//…Discuss how you used heatmaps, A/B testing, and psychological triggers to boost a landing page’s conversion rate by X%. Focus on the “Human” element—understanding user friction and solving it through better copy and design.;
{#}
<services>
…Bridging the gap between seven-figure media buying and cutting-edge automation. I build high-scale revenue engines that are future-proofed for the AI-driven search era..
{“_Enterprise Paid Media Scaling “}
{“_AI-Native Search & GEO Strategy “}
{“_Headless Marketing Automation “}
{*}
<contact_me>
…Whether you’re looking to scale a multi-million dollar ad budget or future-proof your brand for the AI-search era, I’m here to help architect the solution. Let’s discuss how we can turn your marketing infrastructure into a competitive advantage..